

232: Intel Building Taiwan in Ohio?, Shopify Logistics pt.2, Big Tech Fiber, EV Efficiency, Open Source Faux Pas, Star Wars Trench Run, and CODA
"many books won’t be written because of podcasts"

Do what you can, with what you have, where you are.
—Theodore Roosevelt
💡 There’s so much good stuff out there, but also so much noise.
I feel like curation is under-rated these days (not that it’s *not* valued, but I think it’s more valuable than most people realize — similar to what I wrote about the importance of curating who you follow on Twitter, because these upfront decisions make a big difference to the quality of what you will think about in the future).
The right idea at the right time can totally change a life for the better, but with just some minor butterfly-flaps-its-wings type of random fluctuation, maybe that person is never exposed to that idea, or it doesn’t hit them in a way that sticks, etc...
It’s not something we have absolute control over, but we can tilt the odds in our favor by designing a good info diet and finding trusted sources.
🔪 Posting that knife maintenance video in edition #230 reminded me that I was overdue to sharpen my own knives.
Boy, what a difference it made!
Knives get dull a bit similarly to how people go bald: It happens slowly enough that you don’t notice it, until one day, it hits you (I’m lucky when it comes to hair 💇🏻♂️, but my knives still get dull).
In D&D parlance, you could say that my knives went from ‘slashing damage’ to ‘blunt weapons’ over the past few months. But after a go on the Sharpmaker, they now feel like I could do surgery with them.
Such a good feeling to cut a tomato and have perfect control over the cut with minimal pressure… *chef’s kiss*
🤩 It was a really good idea to ask for comments on the last edition, because that edition has over a 130 comments, most of them really nice, with useful suggestions and feedback.
You guys & gals rock 🤘
Buffett talks about getting the shareholders you deserve.
Well, I don’t know if I deserve you, but through whatever happy accident of history, I feel like we’ve got a really great group of people, self-selected for broad curiosity and desire to learn and improve, and that’s exactly the kind of people that I want to interact with. Cheers 💚 🥃
🛸 🧠 What if you could pilot an incredibly complex and sophisticated alien spacecraft.
Everything would be organic shapes, with nanotech machinery that makes it look like it works by magic, as you’re controlling it with some kind of thought-activated neural-link.
Well, when you think about it, that’s kind of what your body is.
A really really complex machine running trillions of processes with nanoscale precision, and it looked like magic until humanity had tools advanced enough to augment our senses and figure out what’s going on.
And you metaphorically sit up there, in the control room, and pilot it using only your thoughts. Cool, no?
📚🗣🎙🎧 I have this theory that many books won’t be written because of podcasts (I also suspect that many books won’t be read because of podcasts, but that’s a different thing).
Authors like Michael Lewis, Sam Harris, Tim Ferriss, Malcolm Gladwell, etc, start podcasts and realize that the dopamine is nicer on this side of the fence, feedback is way more immediate, you don’t have to spend hours and hours on writing, re-writing, and editing a page, you can open your mouth and let it flow, and you may reach more people and make more money than with a book.
I’m not saying one will 100% replace the other, and it’ll vary a lot case-by-case, but *on average*, I bet many books won’t get written (the absence of something is always harder to notice and impossible to prove, but I think this theory has decent odds of being correct).
💚 🥃 If you feel like you’re getting value from this newsletter, it would mean the world to me if you became a supporter to help me to keep writing it.
If you think that you’re not making a difference by subbing, that’s incorrect. Only 4.77% of readers are supporters (so far — you can help change that), so each one of you joining this elite group makes a big difference. Thank you.
A Word From Our Sponsor: 📈 Revealera 📊

Revealera provides data and insights for investors into hiring trends for 3,500+ public/private companies + technology popularity trends for 500+ SaaS/Cloud Products.
We give investors insights into:
Job Openings trends: Insights into a company’s growth prospects.
Technology Popularity Trends: Insights into how widely products like Datadog, AWS, Splunk, etc, are gaining adoption.
Vendor Sign-ups (Currently Alpha) tracks the # of companies, as well as the specific companies, that have signed up for SaaS products such as Zoom in near real-time.
Visit Revealera.com for a ✨free✨ trial/demo.
Investing & Business
‘Intel to invest up to $100bn in Ohio chip plants’
Wait, what? Are they just throwing large numbers out there to regain the “big number” momentum away from TSMC?
An initial $20 billion investment - the largest in Ohio's history - on a 1,000-acre site in New Albany will generate 3,000 jobs, Gelsinger said. That could grow to $100 billion with eight total fabrication plants and is the largest investment in Ohio's history, he told Reuters.
That $20bn number is probably more realistic, but I have to wonder, why Ohio?
Is this a defense-contractor type of move, where you locate something somewhere where the political crosswinds are favorable and you can extract the most governmental support?
Are semiconductor engineers going to relocate from the more traditional US tech hubs to Ohio soon? Cost-of-living certainly will be lower…
Image if the $100bn-8-fabs-future does happen, that would be quite something.
Dubbed the silicon heartland, it could become "the largest semiconductor manufacturing location on the planet," he said.
I’ll believe it when I see it. Sounds like a line targeted at politicians, like, “oh yeah, you’ve heard of Taiwan and TSMC? What if we could build something even better right there, in your district! All we need is…”
To dramatically increase chip production in the United States, the Biden administration is making a big push to convince Congress to approve $52 billion in subsidy funding (Source)
There it is.
Don’t get me wrong, as I’ve written about before, I hope Intel does great, and competition is generally best for customers in the long term, so the future will be better if TSMC doesn’t fully run away with it, leaving everybody else far behind — not because of what happens at that exact moment, but because of what happens 5-10 years afterwards.
📦 Is Shopify Reducing its Logistics Ambitions? (Part 2)
Back in edition #224, I had a section about this, citing a recent interview with Tobi where he sounded a lot less gung ho about arming the rebels with warehouses to create a counter-force to the Death Star aka AmazonLogistics (AMZL).
Well, more bits of data (01111001 01101111 01110101 00100000 01101100 01101111 01101111 01101011 01100101 01100100 00100001) pointing in that direction are coming out:
Shopify has terminated or reduced the scope of its work with several warehouse and fulfillment partners, a move that could vastly reduce its capacity to pack and ship orders for merchants in the near term, Insider has learned.
Executives at four fulfillment companies in Shopify's network confirmed the changes with Insider.
Once Shopify implements these changes, its network is expected to have roughly half of its previous capacity to pack and ship e-commerce orders for merchants, two fulfillment partners told Insider.
It kind of sucks for these partners, because:
Some partners said they offered below-market prices or made other concessions with the belief that Shopify's services would be a success.
😬
I don’t know what happens now with the 6 River acquisition they made for $450 million.
🌊 Big Tech is Hungry for Undersea Fiber Optics 🌊
Where those fiber-optic connections link up countries across the oceans, they consist almost entirely of cables running underwater—some 1.3 million kilometers (or more than 800,000 miles) of bundled glass threads that make up the actual, physical international internet. And until recently, the overwhelming majority of the undersea fiber-optic cable being installed was controlled and used by telecommunications companies and governments. Today, that’s no longer the case.
In less than a decade, four tech giants— Microsoft, Google parent Alphabet, Meta (formerly Facebook ) and Amazon —have become by far the dominant users of undersea-cable capacity. Before 2012, the share of the world’s undersea fiber-optic capacity being used by those companies was less than 10%. Today, that figure is about 66%. [...]
By 2024, the four are projected to collectively have an ownership stake in more than 30 long-distance undersea cables, each up to thousands of miles long, connecting every continent on the globe save Antarctica. In 2010, these companies had an ownership stake in only one such cable—the Unity cable partly owned by Google, connecting Japan and the U.S. (Source)
Business Metabolic Rate
This is an idea that I’ve thought about many times over the years, and I’m not sure if I’ve quite got it distilled to something good yet, but here we go anyway:
There's a mismatch between the metabolic rate of businesses & between our human metabolic rate (not literally, but I mean, our perception of time and natural rhythm).
A few quarters can seem like forever in the context of a human life when things are going truly wrong, but in the grand-scheme, it's pretty short.
Zoom out on one of those long charts, and often whatever happened is barely noticeable from a distance…
Science & Technology
Efficiency of Electric Vehicles
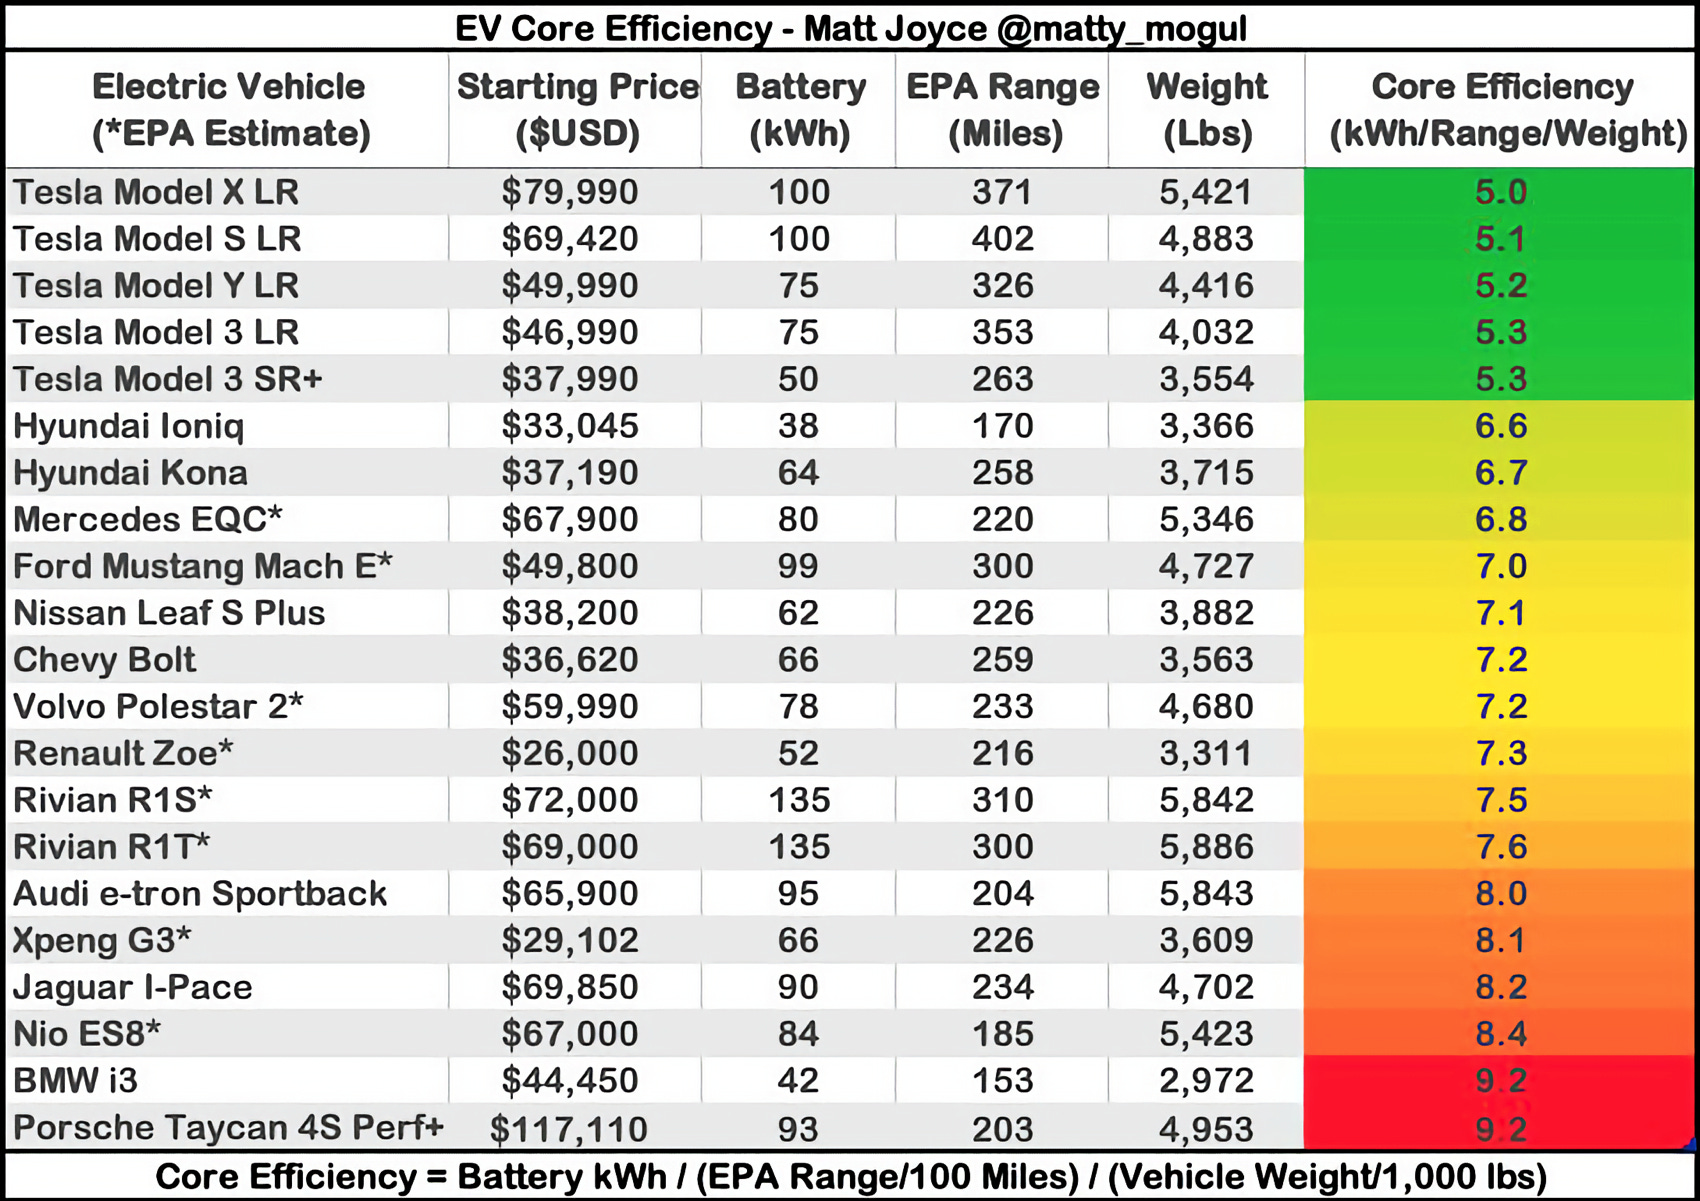
The column on the right shows battery capacity / driving range / weight.
Source: Matt Joyce
Interview: Zeynep Tufekci, my 🧠 crush
I have a big brain crush on Zeynep.
That she’s very very smart is a given, but a lot of people are very smart… What makes her stand out is how often she’s right about things.
This is about very high ‘raw brainpower x effectiveness’, and that’s rarer.
I really enjoyed this interview she did with Ezra Klein:
The Ezra Klein Show: The Pandemic Lessons We Clearly Haven’t Learned (transcript here, if you prefer that)
The way she uses analogies and metaphors is just *chefs kiss* I wish I was that good at thinking and explaining things.
It’s clear she thinks from first principles a lot, or at least, from higher-order principles than most — but once she’s figured out what she thinks about something, she’s very good at coming back down from the abstract and finding concrete practical steps to reduce odds of bad things happening and optimize situations.
She’s also great at avoiding false choices or leading questions.
It often sounds like Ezra believes X and tries to get Zeynep boxed into how he frames the question, and she effortlessly steps back, looks at the big picture, focuses on what really matters, and finds a more useful frame for the situation.
Anyway, I’ll stop stanning her for now…
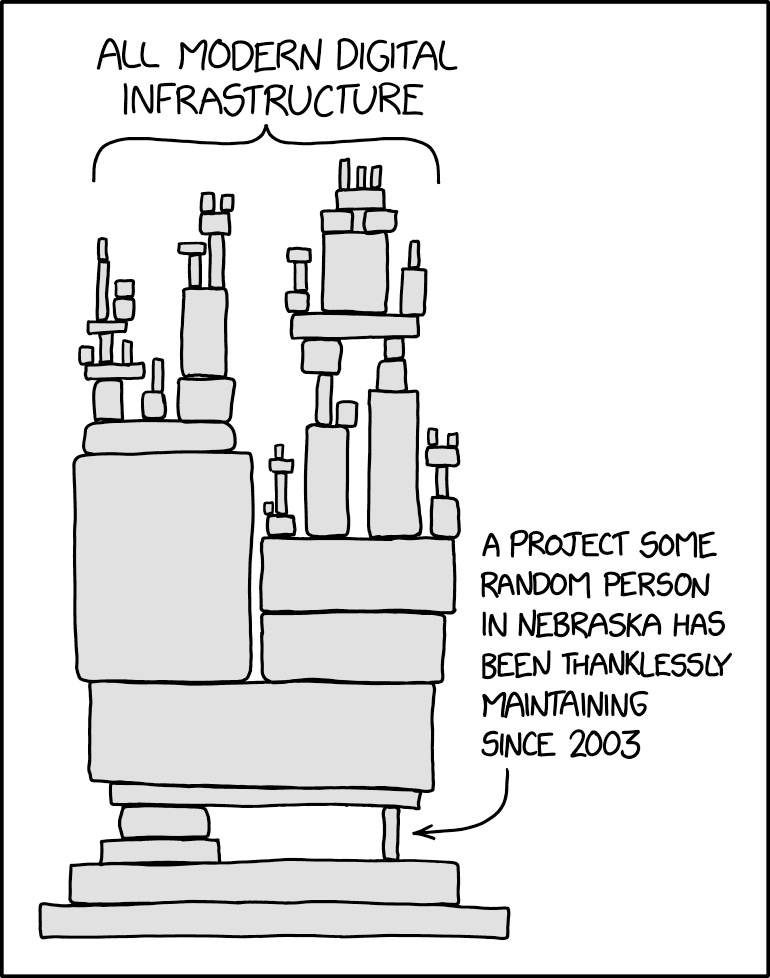
Taking Open Source Software for Granted *tsk tsk tsk*

Probably a good time to repost this evergreen drawing by XKCD:
The Arts & History

CODA (2021, AppleTV+)
“CODA” is an acronym for “Child of Deaf Adults”.
I watched it on Friday, and it’s one of the best things I’ve seen in a while (not that I want to raise expectations, that’s never a good idea — but you also have to be clear enough about how good something is to get over people’s ‘activation energy’ for actually watching it… Tough balancing act ¯\_(ツ)_/¯ ).
Don’t expect a BIG movie. It’s intimate and small scale, about a small family in a small town… But it’s good. It has heart.
For her role in CODA, Emilia had to spend nine months learning American Sign Language, have singing lessons and learn how to operate a professional fishing trawler.
That’s quite the prep work! I wouldn’t be surprised if she went far in the acting world.
I also like how the film looks. It’s not over-stylized, it’s all very natural-looking, but the colours really pop and it looks alive. There’s a good recent piece about how a lot of recent TV and films have a really mushy colour palette, with everything being a certain washed-out tint with muted colours. Thankfully this isn’t that!


If the only thing you’ve watched on Apple TV is ‘Ted Lasso’, well you’ve got to watch the A Dark Quiet Death episode of ‘Mythic Quest’ and CODA, for sure.
CODA is a very different film in many ways, but it also reminded me of the excellent ‘Captain Fantastic’ (2016, Viggo Mortensen, not a superhero film despite title). I recommend it too, ideally while knowing as little about it as possible going in.
VFX Artists Re-Create Star Wars Trench Run with Modern Software Tools
I thought the Terminator 2 video I posted in edition #230 was good, but this may be even better.
Really nice to see all the software tools used to create the “filmic” experience on those 3D models in just a few days of work.
Supposedly, the government of Ohio has provided up to $2Billion in tax incentives for Intel to build the manufacturing in Ohio. The largest ever incentive package for Ohio.
Re Efficiency of Electric Vehicles. I suspect the author was trying to find a nice way to make an apples to apples comparison of the relatively small sample of EVs currently available for sale. While the chart looks very presentable, I don't believe it offers any valid conclusions for a couple of reasons:
1) At steady state highway velocity the energy consumption is dominated by aerodynamic drag, where drag = 0.5*density*(velocity squared)*(drag coefficient)*(Frontal Area). The drag coefficient of a sedan and a pickup are drastically different as are the frontal area. This is why you wouldn't compare an ICE sedan to an ICE pickup truck, same logic applies to EVs.
2) In the city the mass of a vehicle has historically been a large driver of its fuel efficiency. This is because the energy required to accelerate the car is = 0.5*mass*(velocity squared). In the city a vehicle is repeatedly accelerated and then brought to rest because of stop signs, stop lights and traffic. Every time an ICE vehicle is brought to rest all of the kinetic energy is turned to heat as the brake pads rub on the brake disc. This heat is unrecoverable and wasted to the atmosphere. EVs employ regenerative braking where the wheel motors are used to slow the vehicle while subsequently charging the battery. While this process isn't 100% efficient, much of the energy is recovered making the mass of a vehicle much less of the variable driving in city energy use.
In summary, 1) on the highway aerodynamic drag is the driver of energy use, not mass. We can't compare cars and trucks (even if they are EVs) unless we attempt to normalize for drag coefficient and frontal area. 2) If a vehicle employs regenerative braking (as EVs do), the mass of the vehicle is less of a factor for in city energy consumption when compared to a traditional ICE vehicles.
While the chart is pleasing to the eye, I don't believe it offers any meaningful insight. Cars need to be compared to cars and trucks to trucks. Normalizing for mass is not a meaningful way to make the data comparable.
*I am not an expert at anything. I'm open to being wrong.